Your YouTube Studio RPM is a number, sure. But it tells you less than you think: it doesn’t tell you whether it’s high or low for your niche, doesn’t show how it evolves against similar channels, and most importantly doesn’t explain which hidden factors are moving it. This guide walks through how RPM is actually calculated, where to see it, what YouTube Studio hides from you, and how to benchmark it against the observable RPM of your competition.
Knowing your RPM alone is only useful in relation to similar channels. Your operational next step: open YouTube on 5 channels in the niche with profile similar to yours, install TubeKRadar (free, no login), and read the metrics Studio doesn’t show. The gap between what you earn and what your average niche peer earns tells you whether to optimize ad density, geography, or content type.
📌 Key takeaways
- RPM is your real take-home: CPM × monetization rate × (1 − YouTube’s cut, ~45% long-form / ~55% Shorts).
- YouTube Studio shows your number but hides the niche benchmark — the part that tells you if you’re underpaid.
- Real RPM levers under your control: geography, ad density, mid-roll placement, advertiser-friendly categorization.
- Estimate other channels’ RPM with views × niche CPM × YouTube cut — TubeKRadar overlays the inputs live on YouTube.
RPM vs CPM: the confusion that hurts half of all creators
Before measuring anything, lock down both terms. They get confused constantly and the confusion ends in false readings:
- CPM (cost per mille): what the advertiser pays YouTube per thousand impressions of their ad. The raw market price of advertising.
- RPM (revenue per mille): what YOU earn per thousand video plays, after YouTube takes its cut and accounting for non-monetized views.
The relationship: RPM = CPM × monetization rate × (1 − YouTube’s cut). YouTube takes ~45% on long-form and ~55% on Shorts. If your CPM is $10, your real RPM lands around $4–5 on long-form and $3–4 on Shorts, assuming full monetization.
For how niche CPM is built, see the YouTube niche CPM guide. Here we focus on the real RPM that lives in your account.
Where to see your RPM in YouTube Studio (step by step)
- Go to studio.youtube.com with your creator account.
- Left menu → Analytics → Revenue tab.
- You’ll see “Playback-based RPM” as one of the main metrics. It’s your net RPM: total revenue / total views × 1,000.
- Top of the page, pick the period (last 28 days, 90 days, year, custom). Period changes the number: 28 days reflects the current moment, 365 days smooths seasonality.
- For per-video RPM, go to “Content”, click a video, Analytics tab → Revenue.
That’s the data YouTube hands you. It’s fine for knowing how much you earn. It’s not enough to know whether what you earn is reasonable or whether you’re leaving money on the table.
What YouTube Studio NEVER tells you about your RPM
- The observable RPM of your competition. You can’t access other channels’ revenue. What you can estimate: ad impressions × niche average CPM × YouTube’s retained share. That estimate, applied to channels similar to yours, tells you whether your RPM is inside or outside the typical range.
- Real ad-category breakdown. Studio aggregates; it doesn’t separate “videos monetized with a premium tech ad” from “videos that only got house ads”. That difference explains big month-over-month swings.
- Whether your niche has a structural ceiling. Some niches have low average CPM regardless of effort (kids gaming, viral compilations). Studio shows your RPM but doesn’t tell you “your niche caps naturally around $1.5”.
- How many views are monetizable. Studio mixes monetized and non-monetized into the general RPM. If your channel pulls 20% Premium subscriber traffic (no ads but YouTube Premium share pays), your real RPM per monetized video is higher than the average shown.
- Seasonality crossed with your niche. Q4 (October-December) lifts CPM up to 30-40% from advertiser budgets; January-February drops aggressively. Studio shows the numbers but doesn’t contextualize whether your RPM peak is seasonal or structural.
How to estimate the observable RPM of channels in your niche
The exact RPM number of someone else’s channel is private. But you can derive a reasonable range from two public data points:
Manual method
- Identify 3–5 channels similar to yours (same niche, same language, ±50% subs).
- Look at their videos from the last 90 days. Compute average views per video.
- Apply the niche’s public CPM range. For 2026 niche benchmarks, see the YouTube niche CPM guide.
- Adjust for YouTube’s cut (~45% on long-form, ~55% on Shorts) to get the estimated RPM.
- Compare against your real RPM. If you’re 50% below, there’s clear optimization room (ad density, mid-rolls, per-video monetization policy).
Doing this manually is tedious but feasible for 1–2 niches. Keeping it updated and expanded to 10–15 comparison channels isn’t viable.
Automated method: TubeKRadar as benchmark
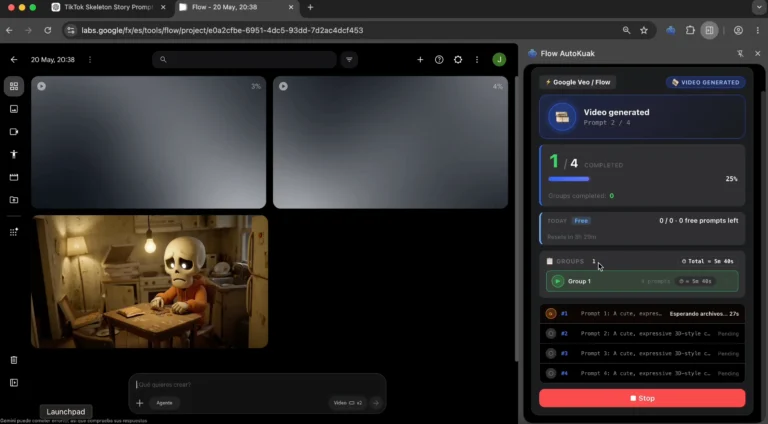
The TubeKRadar module in AutoKuak Suite (free, no login, no cap) automatically overlays metrics on YouTube thumbnails that Studio doesn’t aggregate: views per day since publication, days published, detected niche, and estimated CPM by niche. Operational idea: navigate channels similar to yours, see the data, and derive in seconds a benchmark of what RPM should be reasonable for your channel.
- Open YouTube on any channel in the niche.
- TubeKRadar overlays views/day and estimated CPM on every visible thumbnail.
- The channel panel adds extra context (subs, frequency, median views in the last 30 days).
- Your job: cross that data with your own Studio RPM to spot gaps.
For more on what TubeKRadar measures and how, see the YouTube channel analysis tools guide. For real niche benchmarks, the niche CPM guide above is the most direct source.
💡 Want to see live data on your next YouTube session? TubeKRadar is 100% free, no login, install in 30s.
Factors that move your RPM (and that you do control)
1. Your audience geography
US/UK/Canada/Australia audiences pay ~3-5x higher CPM than LATAM or India audiences. If your channel is English with a heavy US viewership, your RPM rises significantly. Studio shows geography under “Audience”; cross it with RPM by country (visible in revenue breakdown) to see where the real money comes from.
2. Ad density
YouTube lets you toggle pre-roll, mid-roll, post-roll, overlay. Each toggle is an extra monetization slot. Short videos (<8 min) only support pre/post; videos >8 min unlock mid-rolls, the highest-impact RPM driver. If your videos hover at 7-9 min, consider stretching to 8+ min to unlock mid-rolls.
3. Content type (advertiser-friendly)
Strong language, controversial topics, sensitive content drastically reduces ad supply. Studio flags every video with a green/yellow/red monetization icon. Yellow videos earn significantly less. If your RPM drops month-over-month and nothing structural changed, check how many videos sit yellow.
4. Seasonality
Q4 lifts up to 30-40%, Q1 drops aggressively. Comparing January RPM against November shows a brutal fall that does NOT reflect a channel issue. Always compare equivalent periods year over year.
5. Watchtime and engagement
YouTube prioritizes monetization in videos with strong watchtime and engagement. A 10-min video with 60% retention monetizes better than a 10-min video with 20% retention, even at equal view count. The metric most strongly correlated with RPM isn’t title CTR — it’s average watchtime.
Practical RPM benchmarks by niche in 2026
Reference ranges for channels with mixed US/EU/LATAM audience. Real numbers depend on the factors above; treat this as a starting point, not absolute truth.
| Niche | Estimated RPM (long-form) | Estimated RPM (Shorts) |
|---|---|---|
| Personal finance / investing | $10–25 | $0.03–0.08 |
| Tech / AI / SaaS reviews | $8–20 | $0.02–0.06 |
| Business / entrepreneurship | $8–18 | $0.02–0.05 |
| Health / fitness | $5–12 | $0.02–0.04 |
| General education | $4–10 | $0.01–0.03 |
| Adult gaming | $3–8 | $0.01–0.03 |
| Entertainment / vlogs | $2–6 | $0.01–0.02 |
| Kids gaming | $0.5–2 | $0.005–0.015 |
If your real RPM lands inside the range, all good. If significantly below the lower bound of your niche, optimization room exists (mid-rolls, geography, yellow content). If above the upper bound, you likely have premium audience or high ad density — verify you’re not sacrificing retention.
Optimizing RPM without destroying retention
- Mid-rolls with judgment. Toggle mid-rolls only at moments when the viewer is already engaged (>3 min) and at natural cuts (topic change, before reveal). Random mid-rolls destroy retention and RPM falls long-term.
- Calibrated density. More ads = more impressions = higher theoretical RPM, but there’s a saturation point where audience drops. Start with 1 mid-roll on 8-10 min videos, 2 on 12-15 min, 3 on 15-20 min.
- Manually mark each video as ad-suitable. YouTube’s auto-categorization tends to be conservative. If your video has no sensitive content, explicitly mark “suitable for all advertisers” to unlock the full inventory.
- Target premium audience gradually. English videos with US-relevant content (even with neutral voice) attract more US viewership and lift RPM. Don’t translate everything: spot videos where content is geographically neutral and export those in EN.
- Long-form over Shorts if monetization is priority. Shorts pays ~10x less per view. If primary goal is revenue, prioritize long-form and use Shorts only as a channel front door.
Common mistakes when reading your RPM
- Comparing month-over-month without seasonality adjustment. December vs January doesn’t compare; December 2026 vs December 2025 does.
- Looking at aggregate RPM and not per-video. Your average RPM might be $5 with one video at $20 and nine at $1. Identifying the top videos and replicating format is what moves the needle.
- Applying English-language benchmarks to Spanish channel without discount. What an English channel earns at $10 RPM, a comparable Spanish channel typically earns at $3-5 due to geography.
- Optimizing density without measuring retention. Bumping mid-rolls from 1 to 3 can lift RPM 50% the first days but tank retention weeks later. Measure both metrics jointly.
- Ignoring geography breakdown. Studio gives it under “Revenue by country”. The most underused metric, and the one that fastest tells you where the money actually comes from.
Frequently asked questions
How long until a new video’s real RPM appears?
The first 48-72 hours RPM swings hard. By day 7, the number stabilizes if the video pulled normal traction. For reliable analysis, wait at least 14 days from publication.
Why is my Shorts RPM 10x lower than long-form?
Shorts monetizes from a different aggregated pool: YouTube splits a fraction of ad revenue across all eligible Shorts, weighted by views. By design, Shorts individual RPM caps much lower than long-form.
Does YouTube Premium affect my RPM?
Yes, positively. Premium subscriber views pay via a share of subscription revenue weighted by watchtime. That’s why channels with strong premium audience (tech, productivity, finance) show real RPM higher than ads alone.
How do I see the RPM of a channel that isn’t mine?
Not exactly. Only estimate it: views × niche CPM × YouTube cut. TubeKRadar automates by showing views and niche-estimated CPM per thumbnail.
RPM dropped suddenly — what to check first?
Three quick checks: (1) did a major video fall yellow? (2) did traffic geography shift (more LATAM, less US)? (3) are we in Q4→Q1 transition? If all three return negative, drill into the per-video detail to find the outlier.
Worth paying for external RPM tracking tools?
Only if your channel earns >$1,000/mo and a 10-15% optimization pays the tool. For small channels, Studio + free TubeKRadar covers what’s needed.
Next step: benchmark your RPM against your niche
If you’re still monetizing for the first time and RPM isn’t your urgent question, the post how to see YouTube channel revenue is the prior step. To understand how niche CPM is constructed (the input to these formulas), the CPM by niche guide is the source.